| 🔍 > Lean Terms Directory |
Affinity Diagram
One of the more unusually named Lean tools, the affinity diagram is not really a diagram at all. It is more of a sorting and grouping process to organize ideas into manageable chunks.
The process is simple:
- Collect ideas, whether through brainstorming, VOC (voice of the customer) or some other means.
- Record the ideas onto separate cards or sticky notes.
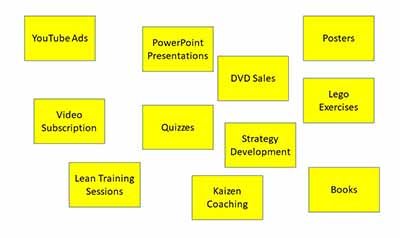
Brainstorming for Velaction’s Revenue Sources
- Begin placing similar cards/notes into groups.
- This step can be done in silence, with each person placing their own cards where they feel the ideas belong, or as a group.
- If a card could fit in two categories, make a duplicate and put it in both.
- Create logical headings for the groups in the affinity diagram.
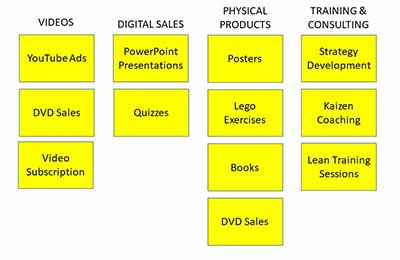
Affinity Diagram for Velaction’s Revenue Sources
The end result of the affinity diagram is a few clusters of related ideas that can be more easily analyzed and acted upon.
2 Comments
Sanjeev Goel · September 3, 2010 at 11:31 pm
So, in case of shopfloor problem this Affinity diagrame is usefull for sorting possible causes into man, machine, material, method etc categories which will be a good input to make Ishikawa diagram.
Jeff Hajek · September 3, 2010 at 11:44 pm
Absolutely. The cause and effect diagram is just a bit more specialized than a basic affinity diagram.
The most common time I use it, though, is right after a brainstorming session to come up with improvement ideas. It lets me see which ideas are the most common, and makes it easier to come up with a plan when the ideas are categorized.