Pareto Chart Template
A Pareto chart is a valuable prioritization and communication tool. It is simply an ordered bar chart showing the most common item on the left and the least common on the right. This tool capitalizes on the 80/20 rule. In effect, this rule says that 80% of whatever it is that you are looking at comes from just 20% of the factors. By focusing on those vital few items, you can get outsized results.
This Pareto Chart Template allows the user to enter a series of data point in any order. The template will place the items in the correct order and will create two versions of a Pareto chart. One has the cumulative percentage line, and the other presents only the sequenced bar chart.
The instructions for this Pareto Chart Template are included in the Excel file.

The following instructions are included in the Pareto Chart Template. Many of these instructions are also embedded into the data entry sheet.
Assumptions
This template is only for the presentation of data. It presumes that you have already selected your ranking factors and have collected the appropriate data.
Step 1. Confirm the factor you will rank by
Make sure you understand what factor you will be ranking. You may be counting the total number of incidents, labor hours, or cost associated with a defect. Be clear.
Step 2. Fill out the chart title
Enter the chart title. We recommend you include the date range during which the data was collected.
Step 3. Fill out axis titles
Enter the title for the horizontal axis. It should describe the factor that is tabulated.
Enter the title for the vertical axis. It should include the units.
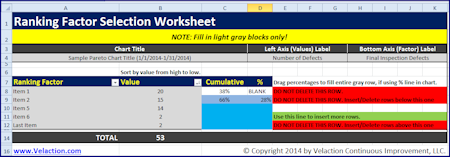
Step 4. Adjust the size of the data table
The chart is designed to be expandable to accommodate any number of groupings you are using. Select the row with the green cells and use the “insert above” function.
IMPORTANT: Do not change the layout of the top or the bottom two rows (shown in red).
Step 5. Enter the data into the gray boxes
Enter the items you are ranking and the value for each item.
Step 6. Rank order the chart
Use the down arrow/menu dropdown in the “Value” heading to sort the data from high to low.
Step 7. Drag the percentages down
Select cells C9 and C10 and drag the handle down to fill the formulas into the cells below them in the chart. You should see an ascending percentage in column ‘C’ if done correctly. You will be dragging the light blue fields over the dark blue fields.
Step 8. View completed charts
This template offers charts with and without the cumulative percentage line.


Words of Warning for Using Pareto Charts
- Make sure that the data for each category is collected from the same time bucket. That means the exact same time period, not the same length of time. Collecting data for item “A” on week one and data for item “B” on week two may introduce some error into the system if an unexpected event biased the data collection for only one of the weeks.
- Be sure about what you are looking at. For example, “quality” could be measured in labor hours to fix, dollars to repair, or total number of incidents.
- Don’t use inclusive items in your categories. That means if you are doing a chart on fruit, don’t use bananas, oranges, apples, Macintosh, and golden delicious as your categories. (Note: The last two are types of apples.)

There are a handful of tools that can make a significant impact on your ability to solve problems. The two that are at the top of this heap are The Five Whys Form and this Pareto chart template. Both fall into the category of being quick to learn and simple to use. What that means for you is that you have powerful yet easy tools in your kit that will help you improve your processes.
This improvement obviously benefits you by making your work easier to do. It also has the added upside of making you stand out as somebody who can eliminate problems. In a Lean organization or one that has adopted a continuous improvement culture, this skill set is extremely valuable.
Keep in mind that the only way that you will get good at using tools like this one is practice. Look for opportunities to start using it in simple, low risk situations. If you master it when the stakes are low, you will be less likely to make a mistake with less forgiving improvement projects.

No matter how effective a tool is, it is worthless if it is unused. One of the problems with Pareto charts is that they can be time-consuming to make by hand. Another challenge is that it can be difficult to get the scale right. It is also impractical to do several iterations of a chart during a project as the situation changes.
However, many people do not have sufficient skills on Microsoft Excel to make a Pareto chart from scratch. Furthermore, many people are embarrassed to ask for help with something that they think they should know how to do. Or more accurately, they are embarrassed asking for help about things that they think their boss thinks they should know how to do. For that reason, people often choose another less effective route rather than using a Pareto chart in their problem-solving efforts.
This tool is intended to break both of those barriers down. The simple data entry page makes it easy to train your team to quickly put together Pareto charts, and to update it as issues are eliminated.
This template is particularly useful because of how easy it is to interpret a Pareto chart. Unlike some tools, the value and interpretation of a Pareto chart is intuitive. It needs very little explanation. When presented with a Pareto chart, it is a simple matter to take action based on this visual tool. What that means is that there is a very small cost for a big payoff. Teach your team members to use this template, and you will find your team using the tool on their own.