| 🔍 > Lean Terms Directory |
Value Stream Map
A value stream map (VSM) is a drawing that depicts the flow of material and information along a value stream. A value stream is the linked series of processes that brings a product from raw materials into the hands of the customer, or that provide a service to a customer.
This map is generally hand drawn, as it lets the mapper record information on the spot. For that reason, it often looks a little scruffy from traveling around the company.
Many people will copy a value stream map into a graphics program, such as Microsoft Visio, which has a stencil pack to support VSMs, or something less sophisticated, like PowerPoint.
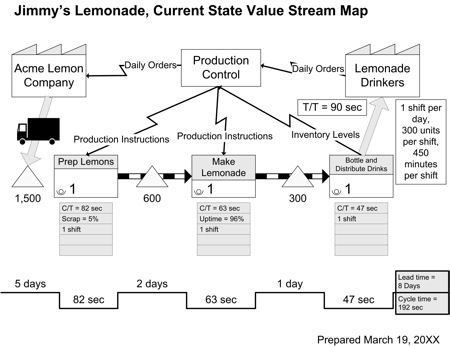
This basic sample comes from my book, Whaddaya Mean I Gotta Be Lean?

Each process on a VSM is shown with a process box, identifying the number of operators, and a data box below it. The bottom of a value stream map shows the production “heartbeat”, the relationship between cycle time (actual work happening) and waiting time while inventory is queued up. Combining these two times, the VSM shows the lead time the customer is facing.
A current state value stream map shows a snapshot of how things are now. A future state map shows the “should be”.
2 Comments
ratfink · July 3, 2012 at 10:15 am
Hi Jeff, Any plans for a VSM module in the near future?
Jeff Hajek · July 5, 2012 at 7:48 am
Absolutely in the plans. It is an important module. Hopefully it will be in the near future, but I have a pretty long list of other projects. My best guess is 3-4 months out.
Thanks for asking. Always good to learn what is missing from my product line.
Jeff