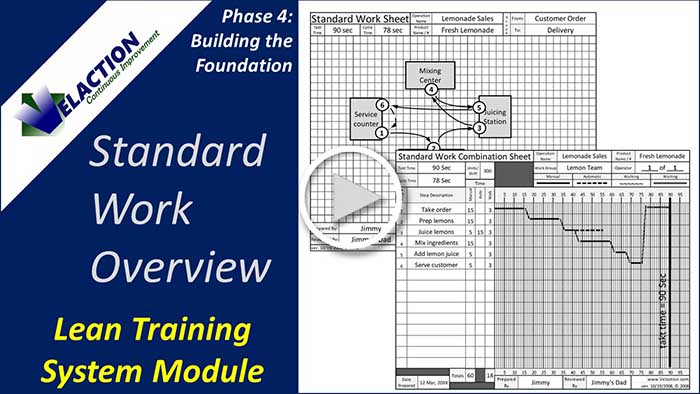
Time Observation Sheet
The Time Observation Sheet is one of the four primary forms for developing Standard Work.

The others are:
The Time Observation Sheet is used to, not surprisingly, observe the cycle times of the steps of Standard Work.
Unfortunately, many people dislike filling out this sheet for the simple reason that is it monotonous and fatiguing. To accurately determine cycle times, many observations are required. This means standing in a work area with a clipboard, concentrating deeply on watching an operator so no times are missed.

You may see many different opinions on how to designate times for Standard Work. Feel free to adjust the later steps in the Time Observation Sheet process to suit your needs and Standard Work philosophy.
- Draw a map of the work area on a Standard Work Sheet. (This will not be the final version of the Standard Work Sheet—it is just a working document). I recommend that observers photocopy the map of the area without any additional markings on it to create a template. Be sure not to draw in anything that might change. It defeats the purpose of having the template if it is unusable as you make improvements.
- Watch the operator perform his or her work once without writing anything, just to get a feel for the process. The operator should be an average operator (not the superstar or the slowpoke) operating at a sustainable pace.
- Watch the operator a second time, drawing the operator’s path, and jotting down process steps on the Standard Work Sheet. Include “observation points” in the notes. These are specific transition points that act as boundaries between steps. They must be easily observable, discrete points. This creates consistency in how the steps are tracked, preventing variation that makes setting a standard more difficult.
- Fill out the header information on a Time Observation Sheet.
- Write out the steps and observation points on the Time Observation Sheet.
- Place a blank sheet of paper under the observation sheet on your clipboard. This will be used to make any notes about problems you encounter.
- Start the stopwatch at the beginning of the process. Note that the observation point to start a cycle is the same as the observation point that ends the previous cycle.
- Log times down each column above the dashed lines. Don’t reset the stopwatch! Leave the stopwatch running. You’ll be subtracting out the interval times later. It just takes too long and introduces errors to start and stop the watch while you are timing.
- When you get to the last step, just leave the clock running and start on the next column.
- Record between 6 and 10 cycles to be able to make accurate estimates of cycle times for each step.
- If you see a special cause problem that changes the time (adds or subtracts), log the problem on the blank page using this convention: “Step #-cycle #” So, a problem with the 4th step on the 3rd cycle would be 4-3. Be brief—you probably won’t have much time, but make sure the note will refresh your memory. Then circle the time you wrote into the Time Observation Sheet. NOTE: It is easier if you have a second observer with you who can record notes as you focus on timing. If the steps are very short, it is critical to have help to avoid getting behind.
- After the last time, go back and make sure you understand what you wrote on the log sheet. Expand on or clarify any notes you made while the issues are still fresh in your memory.
- Calculate the total cycle time for each column. IMPORTANT: Subtracting cycle times is not straightforward! You’ll have to convert minutes to seconds before subtracting.
- Calculate each of the step times. Log that time below the dashed lines in each column. It will be the time for the end of that step minus the observed time for the previous step.
- Calculate the average times for each row, leaving out the circled steps. Remember, you should have circled any steps with special causes associated with them.
- Write in the low time for each step, again disregarding the outliers.
- With the average as a guideline, use your knowledge of the process to add an adjustment to the low time to come up with a step time. This is an adjustment based on experience. For example, if the low time was 3:35 but the average was 5:11, 3:35 sounds too low. Remember, you already pulled out the big outliers. You’ll still add a buffer for the overall process, so I like to stay away from buffering individual steps. But if there is a large variation, you have to apply some judgement. It might require a bit of investigating as to why the process can sometimes be done significantly faster than others. This situation is an indicator for a potential improvement opportunity.
- Add up all the step times to get a total cycle time for the Standard Work.
Determining the Standard Cycle Time
The final step is to check your work. You will have to compare the tallied step times with your actual observed times. Basically, what happens is that sometimes the operator will be over the individual step times you defined and sometimes under. They will generally come out in a fairly reasonably close range if there is no special cause slowing things down.
But there are special causes happening. You’ll find that, when you compare the observed cycle times to your tallied step time, you may seem too high, too low, or just right.
You’ll have to use your judgement here. In effect, you would fudge the tally higher if it seemed too low. That just means you are adding a buffer to the end of your cycle.
If the tally seemed too high, meaning you embedded too much buffer time, you would go back and adjust your step times.
You don’t actually want to be hitting your time every single cycle. You should have a way for people to call for help early on to stay on track. It reduces the amount of buffer that you have to bury in your Standard Work. The less support you have and the less responsive they are, the more you need to buffer your times.
Remove Special Causes
Before you add in too much buffer time, though, review your problem sheet and see if you can reasonably quickly remove some of the special causes that created the outliers.
Part of the value of Standard Work and the observation process is that it highlights these problems and makes it painful to allow them to exist. The sooner you address your special causes, the less you will need to rely on floaters or other support people to keep processes on track.


2 Comments
virginia moon · October 20, 2010 at 7:56 pm
I noticed you mentioned average time in your discussion. I am training on Time studies at work and they told us that we use our second to the lowest time not average or repeated time. is this correct?
Jeff Hajek · October 20, 2010 at 10:51 pm
Virginia,
Great question. The truth of the matter is that there are a lot of methods, and the choice depends on some other considerations.
If you have a great support system of andon lights and on-call resources to help, setting the time to the second lowest works. Since most companies don’t, the average step adjustment method I describe is a good alternative.
In both cases, though, the real key is in how you manage variation. When operators fall behind (or get ahead) of the expected pace, they should be documenting what is going on, and the team should be taking action to either correct the problems (PDCA), or revise the standard work documenttion if the times appear too high.
Just keep in mind that if you do use the second lowest time, your operator will rarely finish his or her work on time without support. In practice, this means floaters (good method), buffer time between cycle time and takt time (common method), or inventory (bad method).
Hope that clarifies things.
Jeff
Comments are closed.