> Continuous Improvement Articles
Correlation or Causation? Interceptions and the Playoffs.
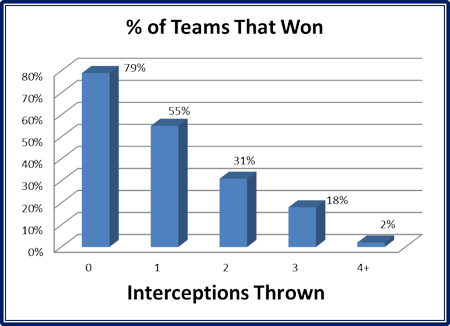
SI.com recently ran an article about the ‘interception ladder’. It looked back at playoff games since 1970, and found an interesting statistic. With each interception a team throws (accidentally throwing to the guys in the wrong jersey) the chance that the team won dropped.
Now, this is a classic case of confusing correlation with causation. If this data truly was a cause and effect relationship, meaning interceptions caused losses, fixing the problem would be simple, and I could be one of the best NFL coaches of all time. In fact, you’d never even need to practice for that game plan.
If you never threw the ball, you could win nearly four out of five times.
Now, anyone who knows much about football will tell you that you can’t win games like that. What that means is that the interception stat is correlated to winning, but may not necessarily cause winning. For example, a better team will often force the other team into mistakes-the interceptions are the effect of the disparity in skill. Or a team that is losing will make riskier throws to try to score quickly.
The Lean lesson is to read into the data and look for the real cause and effect relationships. Remember: Correlation doesn’t necessarily mean causation.
NOTE: The video below was added quite a while after the original article was posted.
Request from readers: I’m going to put together a football and Lean page. I’ve used it as a backdrop for making Lean points a few times. I’ve noticed a few other Lean bloggers doing the same recently, such as Mark Graban’s post on value-added time in a football game. If you know of any other Lean posts with (American) football as the backdrop, please let me know in the comments section below. Thanks!

6 Comments
kiapita · March 15, 2011 at 1:11 am
I believe you are confused about the two concepts, and about football. Causation is never observed, only correlation is, i.e., ANY causal claim is established by correlating two events and then ruling out alternative explanations. That turnovers CAUSE losses is undeniable (or if you prefer HAS A CAUSAL LINK TO LOSING), in that a correlation is established and a further explanation is provided – specifically that these turnovers give the team with a turnover advantage more opportunities to score (and to score from a shorter distance), and the team suffering more turnovers less opportunity. It is a common misconception among those who have had a freshman level logic class that “correlation does imply equal causation”. This is only half true. Correlation is a NECESSARY condition of causation, but not a SUFFICIENT condition.
By the way, the “fixing the problem” solution is rather silly. You would reduce interceptions but also take away one half of the offensive capabilities of a team. It would be like saying “reckless driving does not cause fatal accidents (despite the correlation between the two), because I could eradicate fatal accidents by lowering the speed limit to 10 mph, so see it was not reckless driving that caused those deaths.
Jeff Hajek · March 15, 2011 at 8:06 am
Hi Kiapita,
Thanks for the comment.
Not quite sure what I am confused about, though. As far as the logic, I think the whole point of the article was that you should not confuse correlation and causation. I didn’t explicitly state the meaning of correlation and causation, but I didn’t negate anything you said either.
And as far as the understanding of football, my point was that if you dig deeper into the stats, I am sure you would find that the team that was behind throws more interceptions than the team that is ahead. Interceptions can’t be the cause of something that is already happening.
When teams are losing, they force plays more to get the potential for bigger returns. I would actually go so far as to say that ‘playing from behind causes interceptions’ rather than ‘interceptions cause you to play from behind’. You can trace the actions–a coach sees the scoreboard and checks the time remaining. He moves away from the running game and goes pass heavy, increasing the chances for an interception. The QB throws deep more often, also increasing the chance of a pick. He forces plays that he wouldn’t if the score was closer–throwing into tighter coverage, or trying to make a throw when he is flushed out of the pocket instead of just throwing it away. Conversely, teams that are ahead routinely burn up the clock with a series of runs.
By the way, the game strategy that I suggested, though, was tongue in cheek. I even said specifically that you can’t win games like that.
But despite our disagreement about the subtle aspects of football, I like the clarification about causation and correlation.
Plus, this back-and-forth highlights the complexity of figuring causation out. In fact, the only way to settle our disagreement would be to sit down and come up with a data collection plan to prove which theory is correct. And our discussion is regarding a game with a ball. It could be much more complex regarding sales patterns in the northwest region or failures in a complex manufacturing process.
Thanks again for the comment.
Jeff
kiapita · March 23, 2011 at 9:59 pm
Now that was actually pretty good analysis; that is, examining the various ways that interceptions can affect a game, depending on when and under what circumstances they occur. And you are right when you say that a complete analysis will, if the data is available, give a more accurate picture of what effect an interception has in specific circumstances. As an aside, I should mention that I stumbled upon your blog while searching for more interesting examples to give to my logic students, and this one is a gem – well, for the male students anyway.
The main thing to keep in mind though, when you think about this topic, is that when analysing a claim about causation, all we can ultimately do is rule out alternative causes(or rule out chance, which is the main function of statistics). So the tests that are implied are really just negative tests. There is never direct evidence for any causal inference. I have gone so far to suggest in my classes that textbooks are wrong when they use the phrase “confusing correlation with causation”. I think there is always SOME causal link when a genuine correlation exists. At the very least, there is predictive power to the correlation. One example I love to give my students is the following correlation: when sales of hot chocolate and coffee (to go) is high, crime is low; when sales of soft drinks (to go) are high, crime is high. So lets drink more hot chocolate and lower crime. A little reflection tells us that the “real” cause of the fluctuation in crime rates is due to the weather, not drink sales, but notice that there is STILL predictive power to the original correlation, and a causal link of sorts – specifically a third thing having a causal effect on both drink sales and crime. That is why I think it is more accurate to say “sloppy equating of correlation to causation”, since, as I said, all we really ever have for direct evidence of a causal link is correlation. By the way, if you want to trace the historical roots of this issue read about David Hume and the problem of induction, as it is labeled by philosophers, an simple observation made over 200 years ago by Hume is still a problem for science and philosophy today.
Finally, your comment about “throwing from behind” suggests an interesting possibility, and one that some coaches probably know: that perhaps the best thing a football team can to do lower their interception rate is to practice at running the ball better. Now I know why one time Texas coach Darrel Royal said “there are three things that can happen when you pass, and two of em are bad.”
Jeff Hajek · April 5, 2011 at 6:28 am
I think we could go on and on about the football analysis, but that gets a bit away from the point of this page.
As far as proof, I don’t agree that we can’t prove causation. Newton’s law about equal and opposite reaction is really about cause and effect. You could correlate the speed of one billiards ball to the speed of the other ball, and you would not have to assume a cause, nor rule our alternatives. Newton established that increasing the speed of the first ball will cause an increase in speed of the second ball, which will also be correlated.
I think in reality (business), though, we often have to operate on assumptions with imperfect information.
Tim Swanson · February 2, 2010 at 3:25 pm
Regarding your American Football backdrop question, I just wrote an article for my monthly newsletter titled Offense or Defense. You can access it at the following link http://www.leanenterpriseguide.com/tsg_web_site_009.htm
Enjoy.
Curious Cat Management Improvement Blog » Management Improvement Carnival #87 · February 1, 2010 at 9:28 am
[…] Correlation or Causation? Interceptions and the Playoffs by Jeff Hajek – “this is a classic case of confusing correlation with causation. If this data truly was a cause and effect relationship, meaning interceptions caused losses, fixing the problem would be simple… If you never threw the ball, you could win nearly four out of five times.” […]