| 🔍 > Lean Terms Directory |
Control, Statistical
When a process is said to be in control, statistically speaking, that means that all the variation can be attributed to common causes. All of the observed variation is just a function of the natural randomness built into a system or process.
In a nutshell, an in control process is free of special cause variation.
Watch our Control Charts Video

Keep in mind that a process being in control does not mean that the process is a good one or that it will suit your needs. All it means is that the observed values are within the statistical pattern you would expect, given the process’s history.
The concept of expected statistical variation is at the core of SPC, or statistical process control, which relies heavily on control charts such as the one in this image.
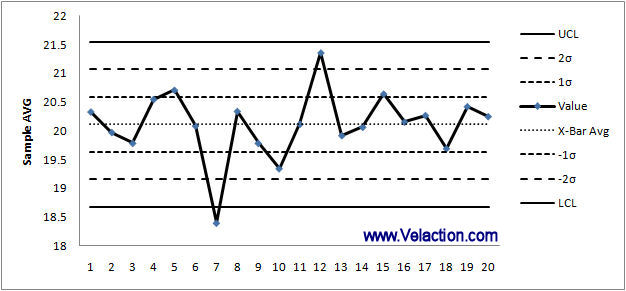
This chart shows an out of control process. There are several tests for whether a process is in control (number above the center line in a row, for example, or a steadily increasing line). In this case, you will note that there is an outlier at day 7. It is beyond the Lower Control Limit, meaning it is more than three standard deviations from the historical mean. While this is not impossible to happen, there is only a 0.3% chance that it does. It is certainly worth investigating.
In Control Does Not Equal Good Performance
As I mentioned earlier, an in control process is not necessarily one that can deliver on your needs.
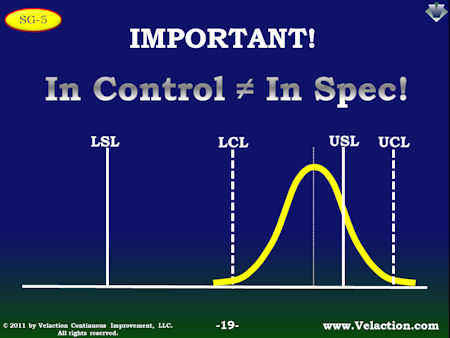
In this image from our control charts overview presentation, you can see why this is the case. It shows a process that exhibits little special cause variation. The shape of the curve exhibits perfect normality but is not centered within the upper specification limit (UCL). Its spread would fit, however, if it was centered. It is in control, but not able to meet your needs.
Improving Processes
When improving a process, there are three basic things you can do.
- Bring the process ‘in control’
- Shift the mean to center the control limits within the spec limits.
- Tighten up the process to bring the control limits closer together. (i.e. reduce the standard deviation)
Generally, it is best to do the items in sequence, though there is a great deal of overlap. A single improvement often affects all three items.
While there is a tendency to want to move quickly, be cautious about making multiple changes at once. It can be hard to isolate whether each change was effective or not.
If the curve is clearly overlapping the spec limit on one side as it is in the previous image, it can be advantageous to start by attempting to shift the mean to center the process within the spec limits.
Practical Application of Process Control
In practice, at the frontline Lean level, you probably won’t personally use any detailed statistical information to show, with certainty, whether a process is actually in control or not. Run charts, however, provide a relatively decent surrogate. Keep in mind that is won’t stand up to any statistical testing, so should only be done when there is low risk.
Still, tracking the average daily cycle time for a process, for example, can give you an early warning if something changes. The indicator won’t be as obvious as it would be in a control chart, but the effort required is far less and you’ll still pick up some instances where your process goes out of control that you otherwise might not.
NOTE: Tracking averages vs. individual cycle times masks noise due to the central limit theorem. If you are trying to reduce common cause variation, you probably will want to track individual times. That takes a lot closer scrutiny that you don’t get with averages, but it is a lot harder to identify those subtle, persistent variations in your process.
0 Comments