| 🔍 > Lean Terms Directory |
Control Limits
Control limits are lines established 3 standard deviations from the mean on a control chart. Keep in mind that the control chart depicts averages, so exhibits a normal distribution. (See Central Limit Theorem) 99.7% of all random variation (common cause) will fall within the upper and lower control limits. Outliers can generally be assumed to be related to a problem (special cause variation), indicating that the process is out of control.
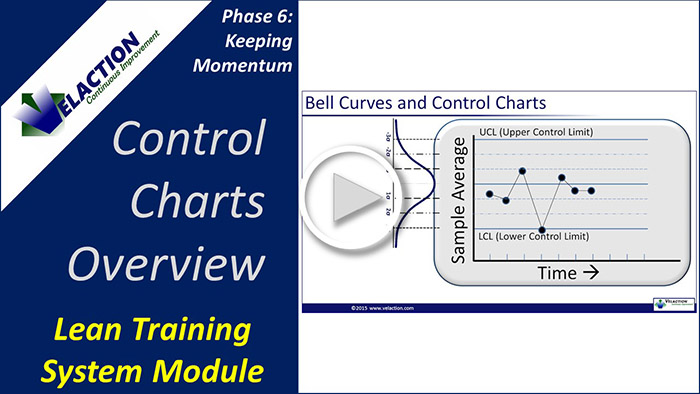
Watch our Control Charts Video

Control limits are generally used for two purposes. The first is to see whether the process is in or out of control. While there are several tests for patterns that lie within the control limits, any outliers are a cause for concern as they are extremely unlikely to happen by random chance.
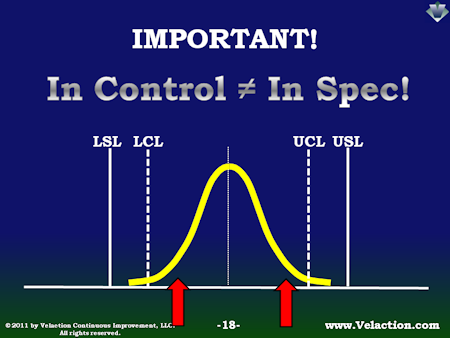
Control Limits vs. Specification Limits
Control limits should not be confused with specification limits. Just because a process does not have a lot of special situations affecting it does not mean it can meet your needs. If the process is in control but the control limits lie outside of specification limits, you will produce bad parts. In the best situation, the control limits will be centered inside of the specification limits with room to spare.
In fact, there is even a way to mathematically look at the relationship between the two. Process capability (Cp) can be described by using the formula for the process capability index (Cpk).
0 Comments