| 🔍 > Lean Terms Directory |
Cause and Effect / Fishbone Diagram / Ishikawa Diagram
A cause and effect diagram is a structured, graphical representation of the possible causes to a given effect.
The purpose of the CE diagram is to provide clarity about the nature of problems. Complicated problems tend to have many contributing factors. The relationships of these potential causes jump out when organized in a visual format.
The cause and effect diagram is particularly popular as a brainstorming tool, useful as both a backdrop against which to generate ideas, or as a way to organize ideas compiled from other brainstorming methods.
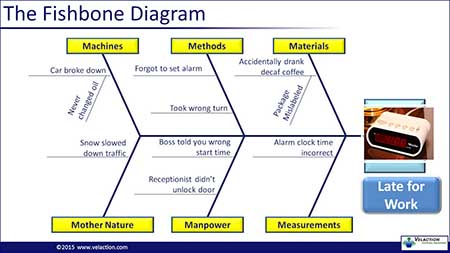
The cause and effect diagram is also referred to by a few other names. The most common alternative name is the fishbone diagram, for obvious reasons. The shape of the diagram bears a remarkable likeness to the skeletal remains of a fish, with the effect being where the head would be. It is also less commonly called an Ishikawa diagram in deference to the man, Dr. Kaoru Ishikawa, who is credited by various people with either creating or popularizing the cause and effect (fishbone) diagram.
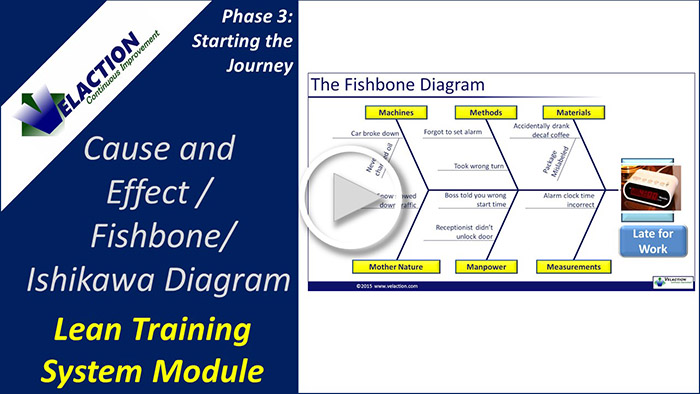
Watch Our Cause & Effect Diagram Video

The cause and effect diagram uses the main branches to group the causes into categories (stratification). Each of these branches can then be further subdivided into progressively smaller groups. The branches will look like a tree in some cases—each major limb breaking into progressively smaller branches. Note that the name “fishbone” diagram is most applicable in simple CE diagrams. For more complex problems, the branching can progress a few levels deep.
You will likely see some standard labels for the main branches.
In manufacturing, the 6 M’s are commonly used:
- Machines
- Methods
- Mother Nature
- Materials
- Measurement
- Manpower
In many cases, Manpower is changed to People in the interest of gender sensitivity.
In administrative or office projects, you will see the 6P’s.
- People
- Process (or Procedures)
- Policy
- Plant
- Programs (software)
- Products
While the 6M’s and 6P’s are the most commonly used labels, you are free to use anything you wish. These branches are not set in stone. Use them as a starting point to customize a cause and effect diagram that works for you: add your own branches, take some away, or even start from scratch. The point is to break the causes into several main categories that inspire critical thinking.
The cause and effect diagram is particularly well suited to organize the results of an independent brainstorming session, or as a part of the actual brainstorming process. In the latter case, the ideas are placed directly onto a cause and effect diagram as they are generated.
Purpose of a Fishbone Diagram
The cause and effect diagram is useful to…
- Break preconceived notions about problems.
- Spur critical thinking.
- Create “aha moments” by seeing how causes interact.
- Encourage the whole team to participate in continuous improvement.
Steps to Developing a Cause and Effect Diagram
Step 1: Define the Problem (Effect)
One of the most challenging parts of solving any problem is defining it. Most companies have no shortage of problems, so the first obstacle is deciding what to work on. Fishbone diagrams are most effective as a team exercise, so they can be costly, in terms of time, to generate. Make sure you are committing your resources to meaningful problems.
Another issue is that many people don’t actually specify an effect in the head of the fishbone. They either try to diagram a symptom, or secondary effect, such as problems removing a Band-Aid, versus why the bandage was needed in the first place. They may also replace the head of the fish with a process or activity rather than an effect. For example, they incorrectly enter “Drilling Holes” rather than “Misaligned Holes”. The difference is subtle, but the latter keeps the team more focused on a specific problem.
Step 2: Assess Information Needs
For some problems, copious amounts of data are available. For others, research might be needed for a team to work effectively. Whether it is a video of a process, a printout from a quality database, or a process walk, team members, especially those unfamiliar with a process, will need a starting point.
Decide on a plan of action on how to collect information to spur brainstorming prior to gathering the team to start the fishbone diagram.
Step 3: Plan Your Fishbone Diagram
The fishbone diagram is relatively simple, but you’ll need to decide the mechanics of how you want to proceed. Will it be done on a whiteboard, with sticky notes pasted to a sheet of butcher paper, or with the use of a computer and projector?
You will also have to decide on the major categories, and whether you will brainstorm directly to the fishbone, or if you will do that step independently and then add them to the fishbone in a second step.
Step 4: Gather Information
In this step, the team will follow up on any data gaps identified in Step 2. For most cause and effect diagrams, this is done through brainstorming while doing the CE diagram. Generally, the people gathered to work through a problem have enough information to create a rather comprehensive listing of potential causes.
But in the situations where more information is warranted, make sure it is gathered prior to assembling the team, if appropriate. Don’t waste your team’s time while one member is sifting through quality records or making phone calls to track down other information.
Step 5: Develop Your Cause and Effect Diagram
Whether real time, or as a second step, the results of the brainstorming session are organized onto the spines of the fishbone. Note that the process of brainstorming separately and then adding the ideas, normally on sticky notes, is commonly referred to as CEDAC, or cause and effect diagram with the addition of cards.
Ideas are assigned to the diagram based on the major categories, and then grouped by similarity. Some of these sub-groups will turn into branches off the main spines as shown in the earlier graphic.
Combine this step with an application of the 5 Whys. For each of the causes, ask why that happened, and add branches if further layers of the problem are uncovered.
Note that during this step, the ideas should be added with little regard as to whether it is truly a cause. The goal is to start with a diagram of potential causes and winnow it down in the next step.
Step 6: Review Your Cause and Effect Diagram
Once the first pass of the diagram is complete, the facilitator should lead a discussion about key observations. Continue to add new ideas throughout this process. The discussion often spurs more brainstorming.
At this point, ideas that are unlikely to be a real cause of the problem should be removed. Ideas that are undetermined should be flagged for further review.
Once you get these likely ideas laid out on the diagram, you will then have to prove whether these are actually causes, or if they were incorrect guesses. Because brainstorming is an unscientific activity, many of the suspected causes do not actually have a relationship with the effect. It is also important to distinguish between causal relationships and correlation. Some of the ideas that initially make it to the fishbone diagram are related, but only through a third factor. For example, umbrellas and worms on sidewalks are linked, but only through another factor, namely rain.
The result of this step should be a diagram that can be used when creating an improvement plan.
Step 7: Act on Your Findings
Because fishbone diagrams are commonly done as a team effort, there is a considerable cost to them. Make sure that the effort drives an improvement effort. Frontline team members tend to be extremely discouraged when they are pulled away from their jobs for a project, and they see no benefit for their time.
Advanced Cause and Effect Diagram Options
Noise to Constant Sheets
One way to further categorize the causes on a fishbone diagram is to label them as either noises or constants. For the purposes of this sheet, these terms are defined as something in our control today (constant), or as something currently outside of our control (noise). Constant doesn’t mean it can’t be changed, just that it won’t change on its own. We get to choose its setting.
For example, we are able to set the temperature of an oven, so it is a constant. Ambient air temperature, however, is outside of our control, which makes it a noise. The general progression is to stabilize the “noisy” cause (i.e. turn it into a constant), and then shift the constant to a desirable value. When a noise can’t be stabilized, the strategy then becomes one of controlling its impact.
Flow Chart Overlays
A powerful method of using the cause and effect diagram involves linking it with a current state process flow chart. The goal is to cross reference the two tools.
If both documents are posted on the wall of a meeting room, you can use string to link the tools, creating a more visual effect.
If you don’t have that option, create a numbering system for the entries on both forms. Then annotate each form with the related number from the other form. Basically, put all the items from the fishbone diagram onto the flow chart, and vice versa.
In many cases, you will see that one process step is particularly vulnerable to a great number of causes. In other cases, you will see that one branch of a cause and effect diagram ties into many more steps of a process than any of the other branches. Both of these situations provide you with a targeted opportunity for improvement.
Format of the Fishbone Diagram
You can choose from several methods of creating your fishbone diagram.
- Write it directly on a whiteboard.
- Pros: easy, legible
- Cons: hard to update, not permanent
- Roll out a long sheet of butcher paper and draw in the basic skeleton. Overlay sticky notes on the paper during the brainstorming process.
- Pros: interactive, no special skills required, easily updated
- Cons: requires a lot of space, hard to transmit, sticky notes can fall off the wall
- Develop it with a computer and projector.
- Pros: easy for skilled operators, permanent, very legible
- Cons: hard for unskilled operator, limited templates available, requires special hardware

Warnings about using the Cause and Effect Diagram
- Make sure the effect is actually an effect.
- Remember that the brainstorming only creates a diagram of potential causes. Verify before acting.
- Act on the results of the diagram to prevent frustrating team members.

Exclusive Content for this Section is available at academy.Velaction.com

Cause and Effect Diagram Key Points
- The Cause and Effect Diagram is also known as the Fishbone Diagram and the Ishikawa Diagram. It also has a variation known as CEDAC, or cause and effect diagram with the addition of cards.
- Advanced options are available to put the CE diagram to use for more complex problems. These include the Noise to Constant Sheet and the process flowchart overlay method.
- Brainstorming is crucial to the fishbone diagram, so the tool works best in a team setting.
- A fishbone diagram is a powerful tool because of the visual representation of the causes. Visual tools tend to make key information jump out at you.
![]()
Velaction offers a Noise to Constant Sheet, a useful tool for moving from analyzing a problem with a fishbone diagram to implementing solutions.

![]()
Practice, practice, practice. This is a tool that is useful right off the bat, but has a long, gradual learning curve before it plateaus. You will continue to learn more tricks throughout the first dozen or so cause and effect diagrams that you do.
Start off with a relatively simple CE diagram. While it might be overkill, it will get you that much needed practice to be able to apply it in more demanding situations.
4 Comments
Bedilu Banda · June 4, 2019 at 2:07 am
I need your pdf document
Jeff Hajek · June 4, 2019 at 7:46 am
Sorry about that. In one of the revisions, I seem to have removed the link. I’ve added in the banner at the bottom. Register in our store and you’ll get the links to free downloads in the customer portal area.
Thanks for your interest.
-Jeff
Vishwas · May 12, 2011 at 11:36 am
The presentation video is really good for understanding. One can easily learn from this.
Thanks.
Vishwas
Jeff Hajek · May 12, 2011 at 1:04 pm
Glad it was able to help you out. I’ve got about 16 more videos in the works right now from my recorded webinars. Stay tuned for some more short videos…