| 🔍 > Lean Terms Directory |
Attribute Data
All data is not created equally. There are many different categories of ways to describe things. Interestingly, there seems to be little consensus on what the terminology means.
The term “attribute data”, if searched for on the web, yields a variety of definitions. Further confusing the issue, some of the data type definitions on one site are called by an entirely different, conflicting, name on another. We’ve attempted to form a compilation of the different definitions to create a somewhat standardized set of data terms.
Click the image to get this slide as part of our Data Collection PowerPoint training.
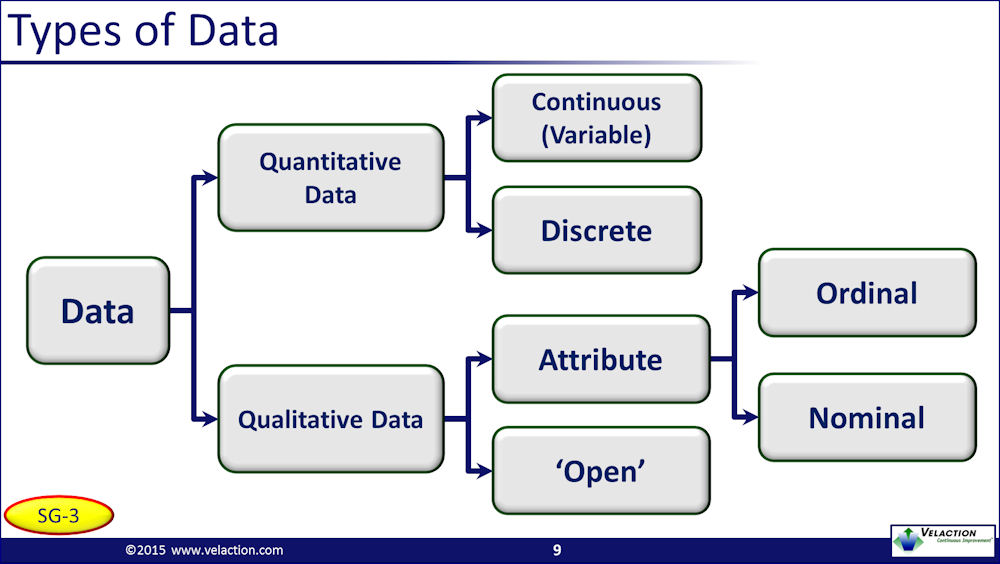
We define attribute data as a qualitative type of data that may be classified and counted. Attribute data may be further broken down into ordinal data, which has a logical sequence to it, or nominal data, which does not.

Attribute data is qualitative in nature and has the characteristic that the answers can be classified, counted, and tabulated.
Attribute data usually comes from a predetermined set of options. Color, for example, has a finite set of choices. Sometimes this set is defined in advanced, and sometimes it is created on the fly. In the latter case, there is a fine line between something being attribute date, though, and ‘open’ data where the data cannot be easily classified and counted.
When data follows a logical sequence, such as “small-medium-large”, it is known as ordinal data. When it has no structure to the set, such as “dog-cat-snake”, it is called nominal data.
The advantage of attribute data is its ease of collection. Evaluating the color of a car, for example, is easy. Creating a gauge on a doorway to tell if a person is short, medium, or tall, can be done without an invasive step. It also can be useful in communication because it distills a complicated concept into something manageable. Putting student grades into buckets of “A,B,C,D,F” is easier to interpret than presenting a listing of percentages.
The problem with attribute data, though is that the assessment is often arbitrary. Color, for example, is actually on a gradient. Orange and red blend, so a color in the middle may require a judgment call. “Go” or “No-Go” on a quality check are similarly based on an opinion if it is collected directly.
Sometimes, though, attribute data comes from actual numerical data. You can measure the size (continuous or variable data) of a part and then classify it as good or bad. Obviously, the measurement step takes effort. It also is a one-way path. You can turn a set of measurements into attribute data, but you can’t take a set of daily go/no-go tallies and come up with the original measurements.

Words of warning when using attribute data:
- If you have the time and resources, always collect continuous data and turn it into attribute data in analysis. Diving into the data often uncovers new questions that are more easily answered with more detailed and flexible data.
- Attribute data can limit responses if you are operating from a set of choices. This is most common in surveys. Adding “other” as a choice with an option for an open response can paint a clearer picture but can also lead to some bias in the data if two people with similar situations respond in different manners.
0 Comments